Lesson 2 introduced basic charts for comparing categorical values, visualizing trends over time, and exploring relationships within data. It also explored the distinction between discrete and continuous dates in Tableau and introduced text tables and callout numbers to emphasize key insights. This lesson introduces additional basic charts and techniques.
Data skills | concepts
Tableau
Working with data
Analyzing data
Learning objectives
Create groups to normalize data, correct errors, and simplify categories.
Apply hierarchies for better data organization.
Use formatting strategically to enhance visual impact.
Analyze data with table calculations.
Visualize part-to-whole relationships effectively.
This tutorial is designed to support a multi-session Tableau for Research workshop hosted by The Ohio State University Libraries Research Commons. It is intended to help the ABSOLUTE beginner, or anyone who is relatively new to Tableau to build the skills and confidence to apply Tableau to research projects.
LESSON 3
Why Practice Matters
Data visualization is a craft. Like any creative discipline, mastering this craft requires exposure to a variety of styles, techniques, and best practices. Just as musicians or artists grow by studying different genres, data visualiers improve by analyzing a wide range of visual storytelling examples.
To sharpen your skills, make it a habit to explore and critically evalute real-world visualizations—both successful and flawed.
Inspiration and examples
Explore data journalism
Major news outlets often feature compelling data visualizations created by professional data journalists. Check out examples from:
The DRAMA framework
The DRAMA Framework —first introducted in Lesson 1—is also useful for critically evaluating data visualizations. It encourages you to consider five key dimensions about the source and integrity of the visual:
Date: When was the visualization created or last updated?
Timeliness matters. Outdated visuals may no longer reflect current realities or data trends.Relevance: Is the visualization appropriate and meaningful for the context or question at hand?
Consider whether the data and its presentation align with the topic or decision being addressed.Accuracy: How was the data collected, processed, and represented?
Look for transparency in methodology, acknowledgment of limitations, and signs of bias or distortion.Motivation: Why was this visualization created, and by whom?
Understanding the creator’s intent helps you assess potential agendas or persuasive framing.Authority: Who is the source, and are they credible?
Evaluate the expertise, reputation, and trustworthiness of the individual or organization behind the visualization.
By applying the DRAMA framework, you can better interpret—or design—visualizations that are not only visually compelling but also credible, transparent, and contextually sound.
Groups and Hierarchies
Why group data in Tableau?
Grouping data is a powerful way to clean and organize your dataset. It allows you to:
Normalize values – Combine similar entries to ensure consistency (e.g., merging “OH” and “Ohio”).
Correct errors – Fix inconsistencies or typos in category names.
Simplify categories – Consolidate detailed values into broader, more meaningful groups.
The simpliest way to create a group in Tableau is to:
Select one or more data points directly in the view.
Click the paperclip icon 📎 that appears in the tooltip.
A second way to create a group in Tableau is to:
Right-click a dimension or measure in the Data Pane
Select Create > Group.
Creating custom hierarchies
Custom hierarchies help save space on a view and add interactivity by allowing users to drill down into more detailed levels of data. In Lesson 2, you saw how Tableau automatically creates a date hierarchy—YEAR, QUARTER, MONTH, and DAY—which can be expanded using the + symbol.
You can create your own hierarchies by stacking one dimension onto another in the Data Pane (or one measure onto another).
Let’s walk through an example:
Duplicate the existing sheet
Right-click the FavoriteAristsAlbums sheet tab.
Select Duplicate.
Rename the new sheet Hierarchies.
Create a hierarchy
In the Data Pane drag album_title and drop it onto Artists.
Filter to show only your favorite albums
Drag Favorite albums group to the Filters shelf.
Select Favorite albums only.
Expand or collapse the hierarchy
Click the
+or-next to Artist to expand or collapse the hierarchy.
Formatting
Effective formatting enhances the clarity and visual appeal of your Tableau dashboards. In Tableau, you can format fonts, shading, alignment, borders, and lines at both the workbook and worksheet levels.
Analysts at The Ohio State University are encouraged to follow the Data Visualization Style Guide to ensure consistency with the university’s brand identity. The guide includes downloadable custom Tableau color palettes—categorical, sequential, and diverging—as well as font usage recommendations and other design best practices.
Applying formatting in Tableau
Format the entire workbook:
Go to the Format menu and select Workbook. This allows you to apply consistent styles across all sheets.
Format an individual worksheet:
Use the Format pane by selecting Font, Alignment, Shading, Borders, or Lines from the Format toolbar.
Alternatively, right-click on a pill and choose Format.
When formatting from a pill, the field name appears at the top of the Format pane. Changes made here apply only to the axis or headers for that specific field. If you close the Format pane and reopen it using the toolbar, the default view applies formatting to the entire sheet. In this case, no field name appears at the top, and you can manually select a dimension or measure from the Fields menu.

Table calculations
Table calculations enhance Tableau performance and efficiency by limiting the scope of computation to what’s displayed in the view, rather than the entire dataset.
Common types of table calculations include:
Running Total
Difference
Percent Difference
Percent of Total
Rank
Percentile
Moving Average
Year-to-Date (YTD) Total
Compound Growth Rate
Year-over-Year (YoY) Growth
YTD Growth
Let’s walk through an example using the ODNR_fish_stocking.csv dataset, last updated on July 1, 2025. This dataset, maintained by the Ohio Department of Natural Resources Division of Wildlife, spans from 1970 to present and is freely available through DataOhio.
You can access the dataset directly here.
Ohio considers data a shared strategic asset and this resource is designed to help anglers:
Identify fishing locations where specific species have been stocked.
Explore detailed stocking histories for waters they frequently fish or are particularly interested in.
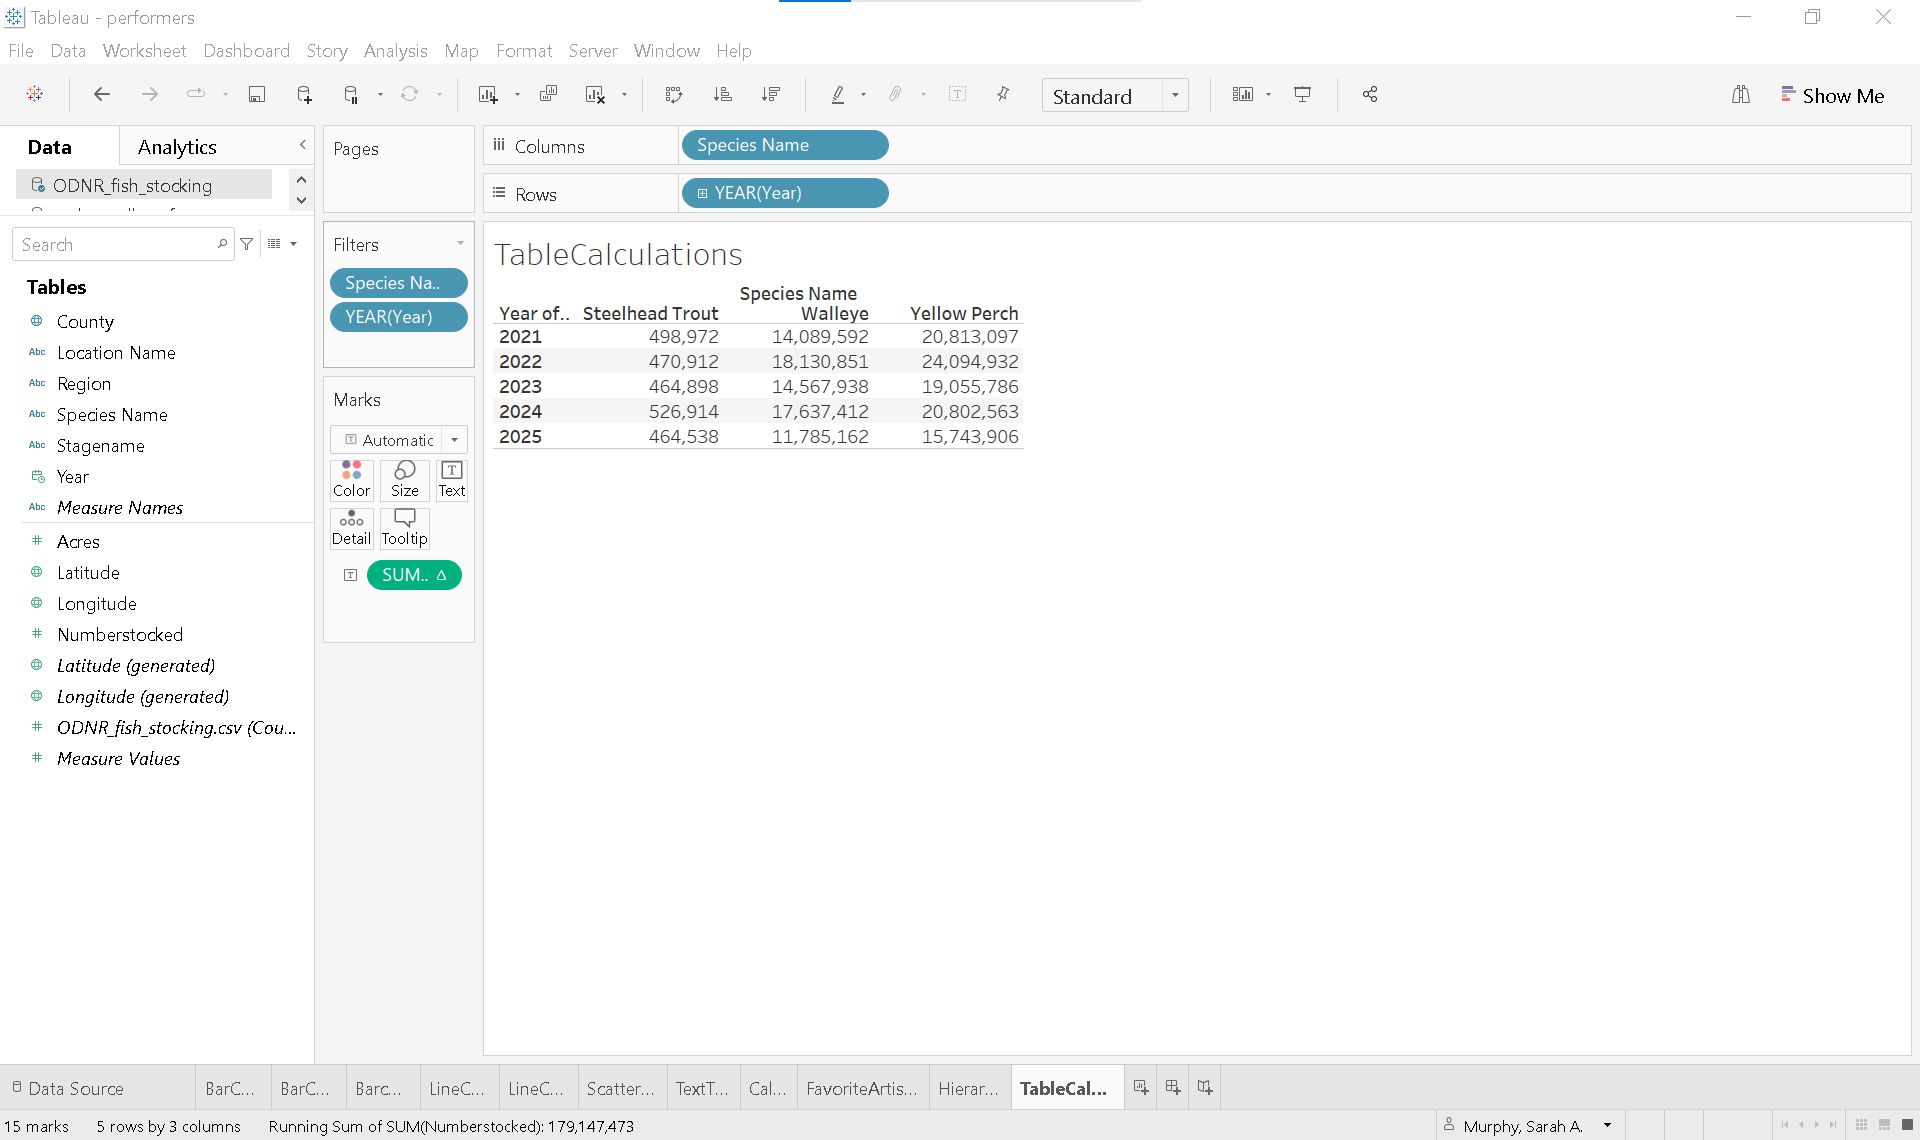
Start a new worksheet and rename it TableCalculations
Connect to
ODNR_fish_stocking.csvdatasetIn the Data toolbar, click New Data Source
Locate the text file
ODNR_fish_stocking.csv.The Data Source page will open, displaying the file on the Canvas.
Return to the TableCalculations tab.
Note: You should now see two data sources on the Data Pane:ODNR_fish_stocking.csvrock_n_roll_performers.csv.
Ensure thatODNR_fish_stockingis selected as the active data source.
Create a text table filtered by selected species
Filter by species:
Drag Species Name to the Filters shelf.
In the filter dialog, select
Steelhead Trout
Walleye
Yellow Perch
Set up the table layout:
Drag Species Name to the Columns shelf.
Change Year to Date & Time data type (if not already).
Right-click and drag Year to the Rows shelf.
In the dialog select a discrete year.
Right-click and drag Year to the Filters shelf.
Filter for the Discrete Years: 2001-2005.
Add measure:
Drag Numberstocked and drop onto the
Abctext in the view to populate the talbe with values.
Note: In 2025, ODNR has stocked approximately:
450,000 Steelhead Trout
11.3 million Walleye
4 million Yellow Perch
Table calculations in Tableau are applied to green (continuous) measure pills. To create a running total, follow these steps:
On the Marks Card, click the ▼ caret on the Numberstocked pill
Hover over Quick Table Calculation ► and select Running Total
At this point, Tableau begins calculating the running total across the table by default. For example, in the year 2021, Tableau adds:
The Steelhead Trout value to the Walleye value,
Then adds both to the Yellow Perch value.
This behavior occurs because Tableau is currently:
Partitioning the data by Year (i.e., grouping by each year),
And addressing the data across the table (i.e., moving left to right across species).
If you want to see a running total within each species (e.g., Steelhead Trout from 2021 to 2025), you need to adjust how Tableau computes the table calculation:
On the Marks Card, click the drop-down arrow on the Numberstocked pill again.
Select Compute Using > Table (Down).
This tells Tableau to:
Partition the data by Species Name,
And compute the running total down the table (i.e., year over year for each species).
Choose an effective visual
Part-to-Whole Relationships
Pie chart
Pie charts are commonly used to illustrate how individual parts contribute to a whole. However, data visualization experts often discourage their use because humans struggle to accurately compare angles and areas, making interpretation less precise than other chart types.
That said, there are situations where a pie chart may be appropriate—such as when the audience expects it or when it provides a clear and immediate visual impact.
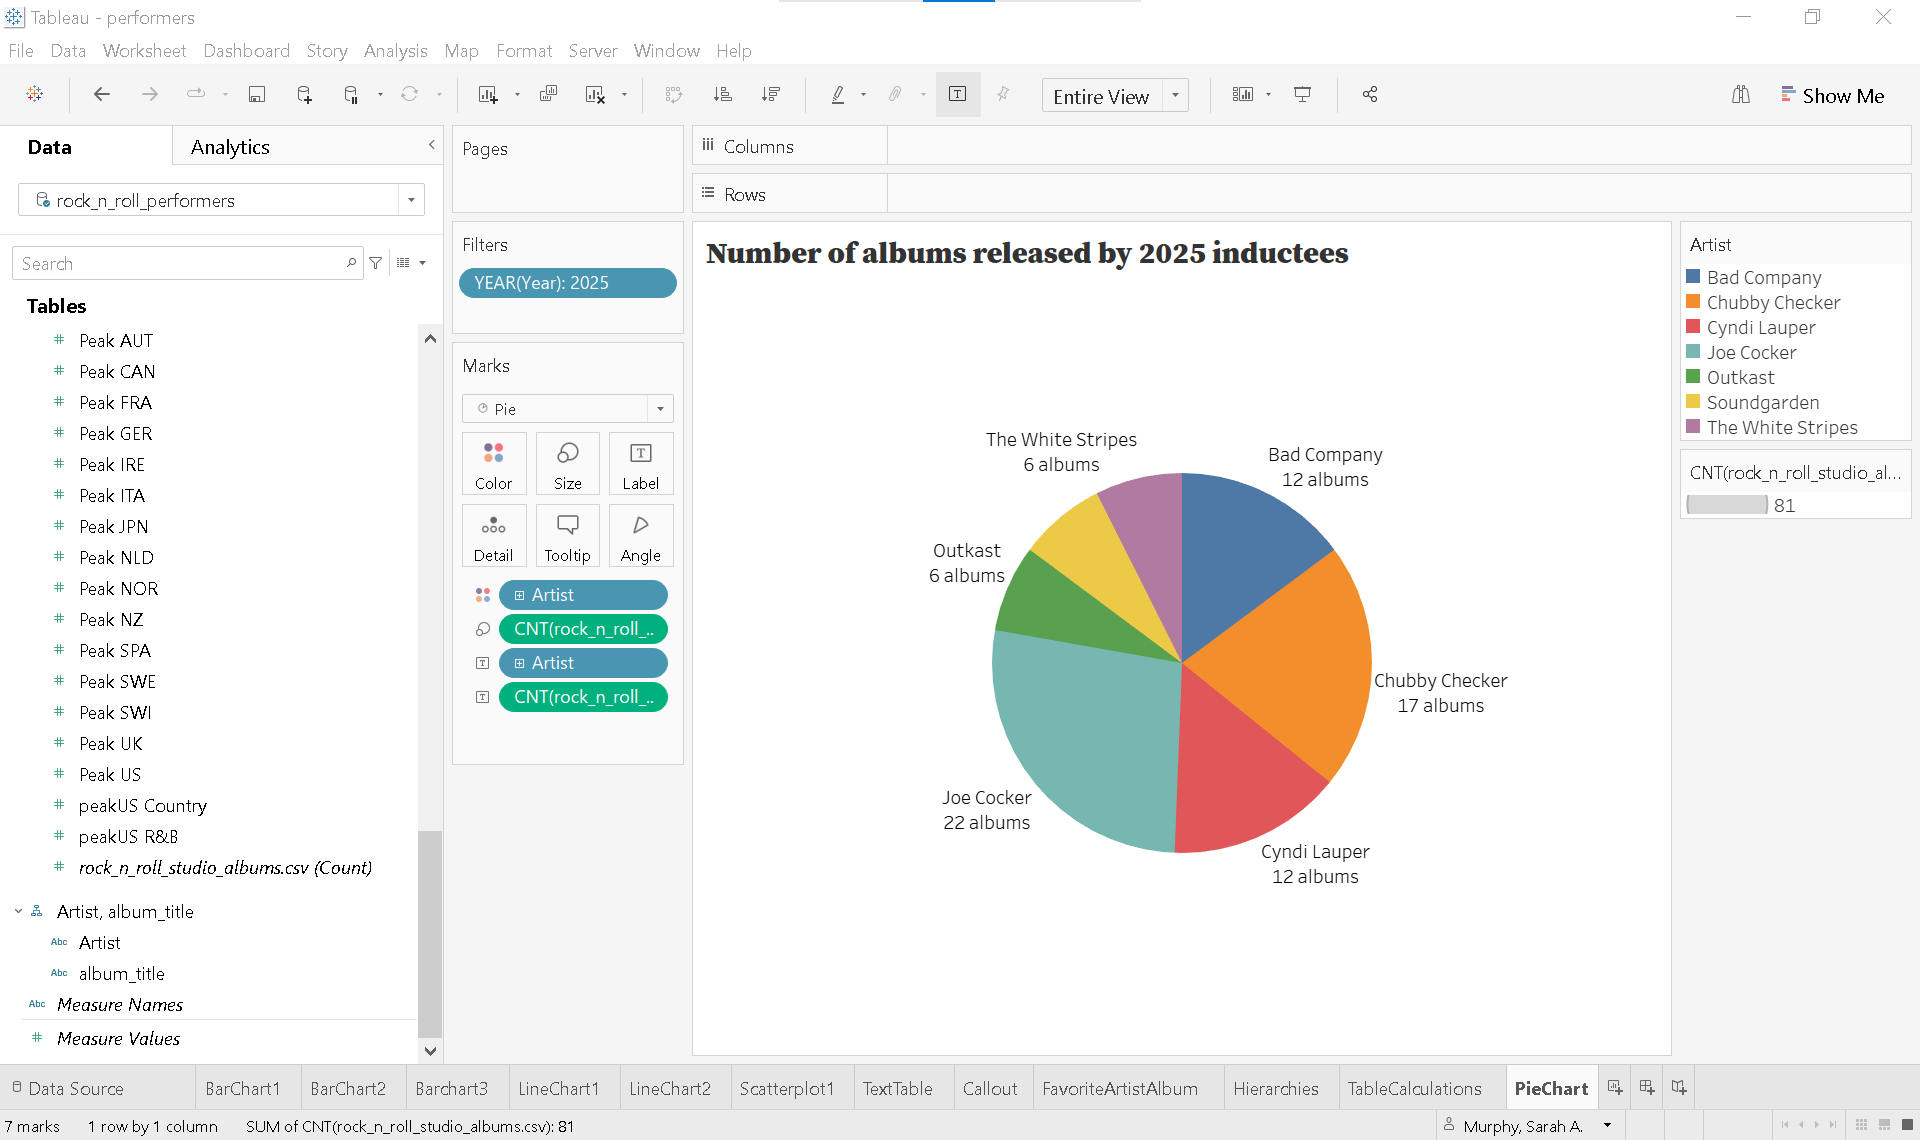
Let’s return to our rock_n_roll_performers dataset to explore the pie chart.
Start a new worksheet and rename it PieChart
Set the active data source
On the Data Pane, select
rock_n_roll_performers.The fields for the
rock_n_roll_performersandrock_n_roll_studio_albumsshould appear.
Filter by 2025 inductees
Change Year to Date & Time data type (if not already).
Filter for the Discrete Year: 2005.
Create the pie chart
On the Marks Card change the marks type to Pie.
Color the pie with a dimension
On the Marks Card, drag Artist to Color.
In the Toolbar, change the view from Standard to Entire View.
Size the slices with a measure
On the Marks Card, drag rock_n_roll_studio_albums.csv (Count) to Size
Add a descriptive title
Double click the worksheet title PieChart.
Enter:
Number of Albums Released by 2025 Inductees
Enhance clarity
Copy Artist and rock_n_roll_studio_albums.csv (Count) to Label on the Marks Card.
Click Label on the Marks Card and select the ... tile next to Text.
Enter:
albums next to <CNT(rock_n_roll_studio_albums.csv)>
Donut chart
The donut chart is a variation of the pie chart, distinguished by its blank center. This design not only offers a cleaner visual but also makes it slightly easier for viewers to compare the relative sizes of each category.
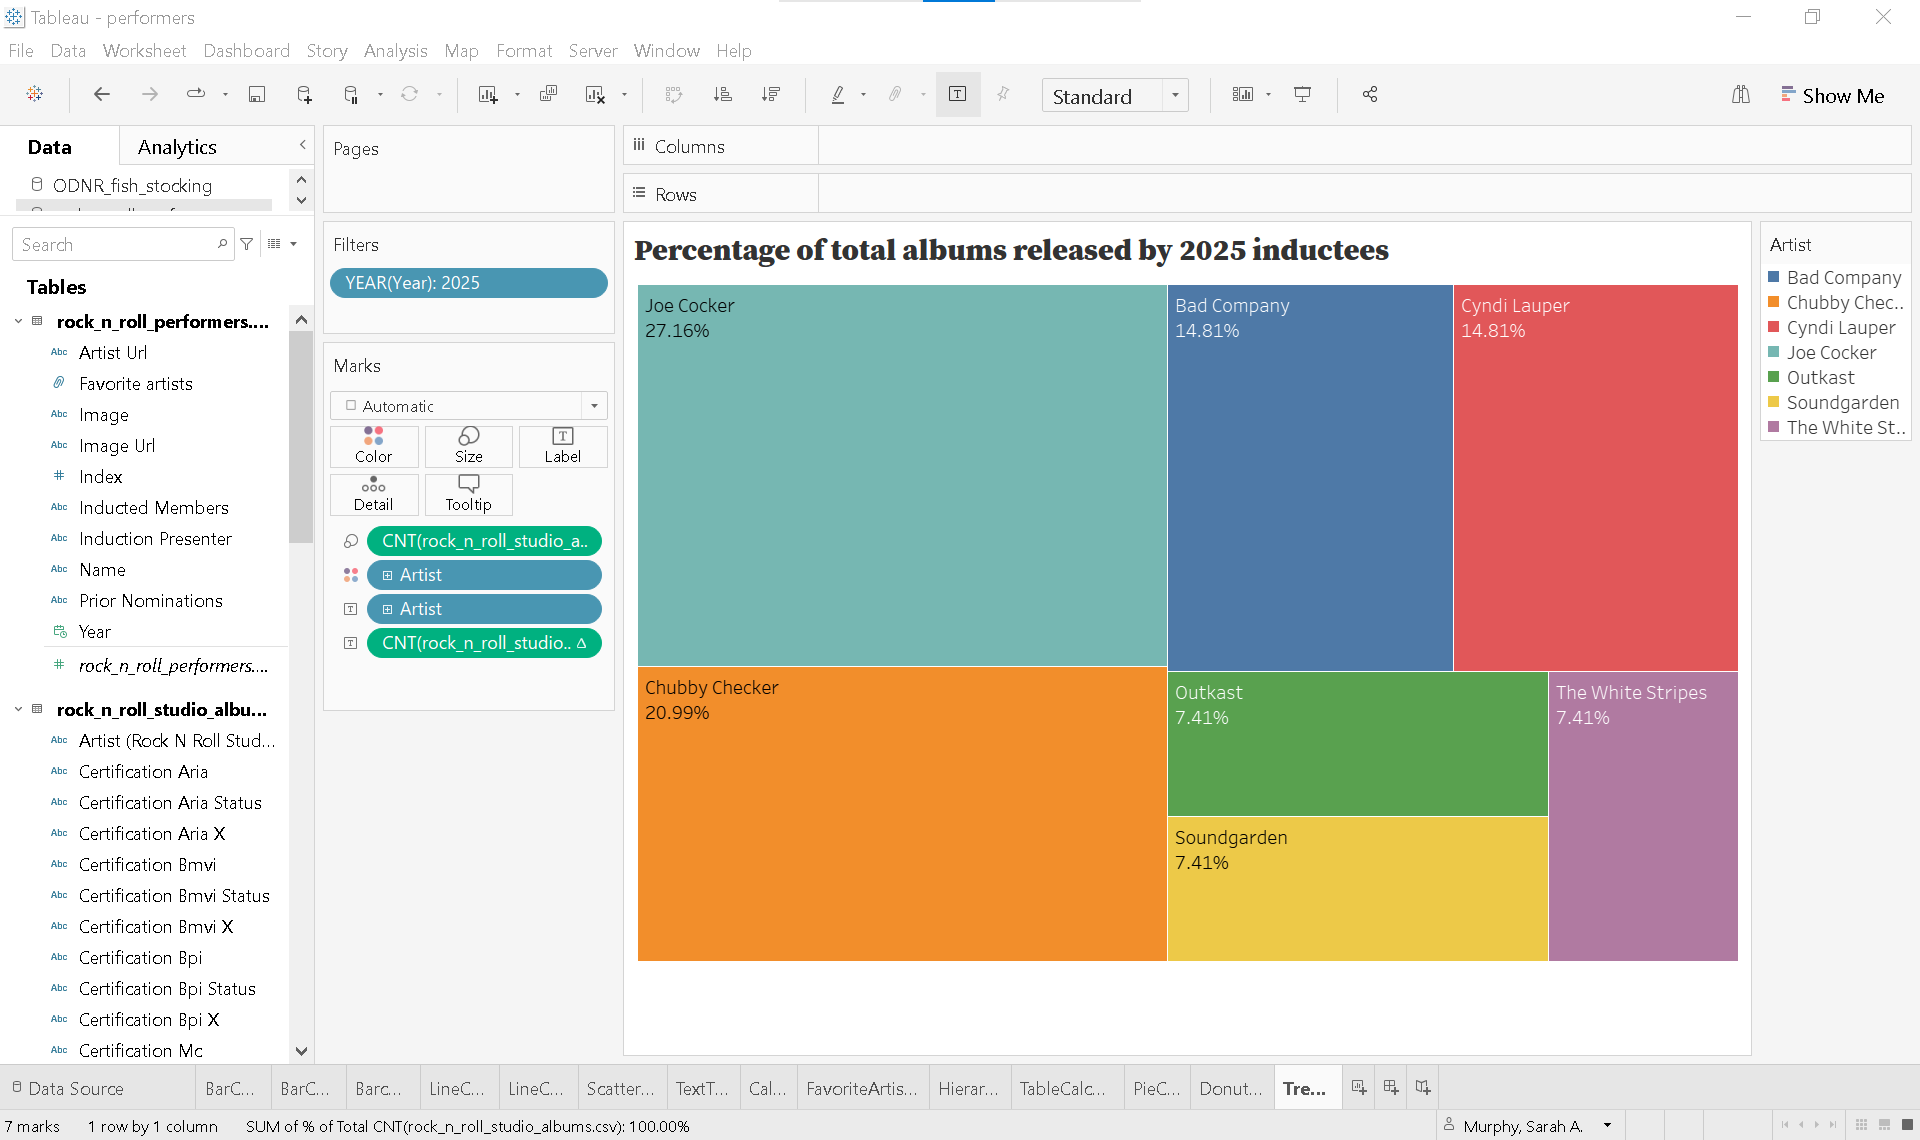
Tree Map
Tree maps are a compelling alternative to pie charts, using nested rectangles to represent the proportional size of categories relative to one another.
Solution
Supplemental readings
Effective Data Visualization
Effective Data Visualization
by Stephanie Evergreen
Thousand Oaks, California: SAGE Publications, 2020.
Chapter 6: “When There are Parts of a Whole:
Better Data Visualizations
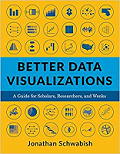
Better Data Visualizations
by Jonathan Schwabish
New York: Columbia University Press, 2021.
Chapter 9: “Part-to-Whole.”